This app will get the information stored in the database and will present it visually. Similarly to the previous apps, to install it you must follow these steps:
Configuring the Secrets
- First of all, you need to add the following secrets for the Grafana app to work:
| NAME | VALUE |
| GRAFANA_PASSWORD | admadm6 |
| GRAFANA_USER | user |
| GRAFANA_INFLUX_URL | influxdb:8086 |
| GRAFANA_INFLUX_ORG | barbara |
| GRAFANA_INFLUX_BUCKET | barbara |
| GRAFANA_INFLUX_PORT | 8086 |
| GRAFANA_INFLUX_TOKEN | tokentokentoken |
- To add them, click the “Advanced Options” icon in the top menu

- Then click the “Add Secret” button and add the secrets according to the previous table:
You can add them manually one by one, or in bulk importing a TXT file. For your convenience we have compiled that list of secrets in the following TXT file. Just download it and import it through the “TXT FILE” button
Installing the Grafana app
- Now you can install the application by clicking the ADD CARD button and choose the “User Docker App” option
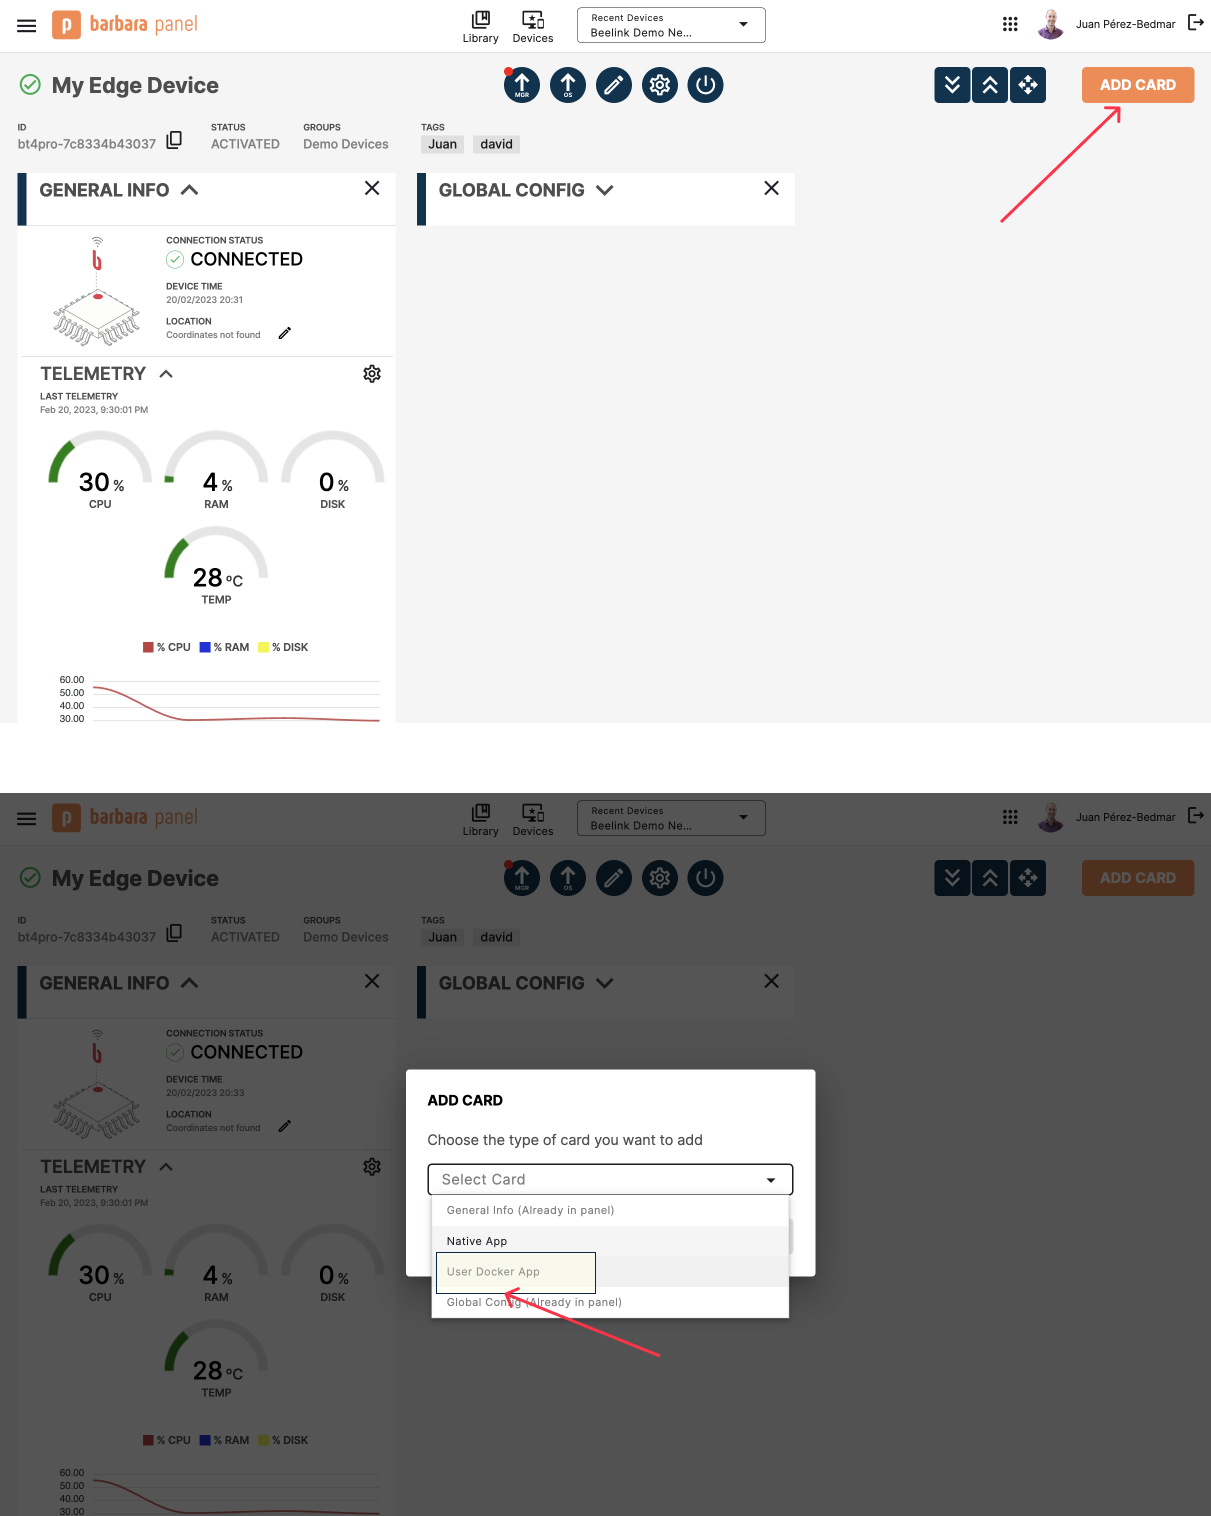
- Select the “Grafana” app from the list of apps and pick the latest existing version. Click SEND button

In a few seconds you should see that the app is up and running
Configuring Grafana with the appconfig file
Finally it’s time to configure some settings of the app via the “Appconfig”. To do so you need to paste the following JSON-format text in the CONFIG section of your application card:
{
  "grafana": {
      "defaultDashboard": {}
  }
}
While the app is running, you can access the database through a web interface by typing the following route in a web browser {IP_DEVICE}:13000, where “{IP_DEVICE}” is your Edge Device’s IP address that you would see in the NETWORK STATUS section of the GENERAL INFO card.
Viewing data in Grafana
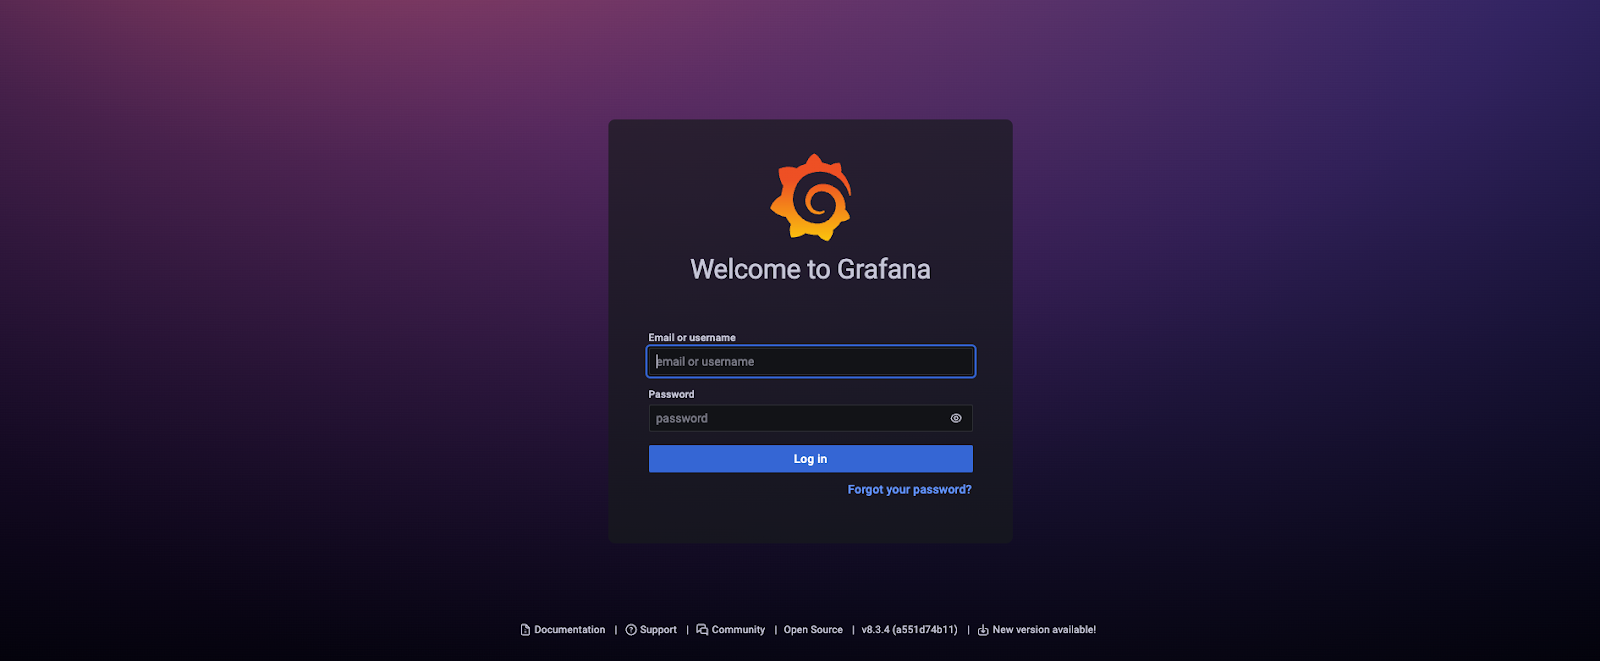
You will be able to login into the Grafana Dashboard by using the GRAFANA_USER and GRAFANA_PASSWORD added in the SECRETS file.
If you are not familiar with Grafana or you want to deep dive on its features, we recommend you take a look at the documentation they have in https://grafana.com/docs/grafana/latest/ but, in any case, you can easily build a very simple dashboard by following these steps:
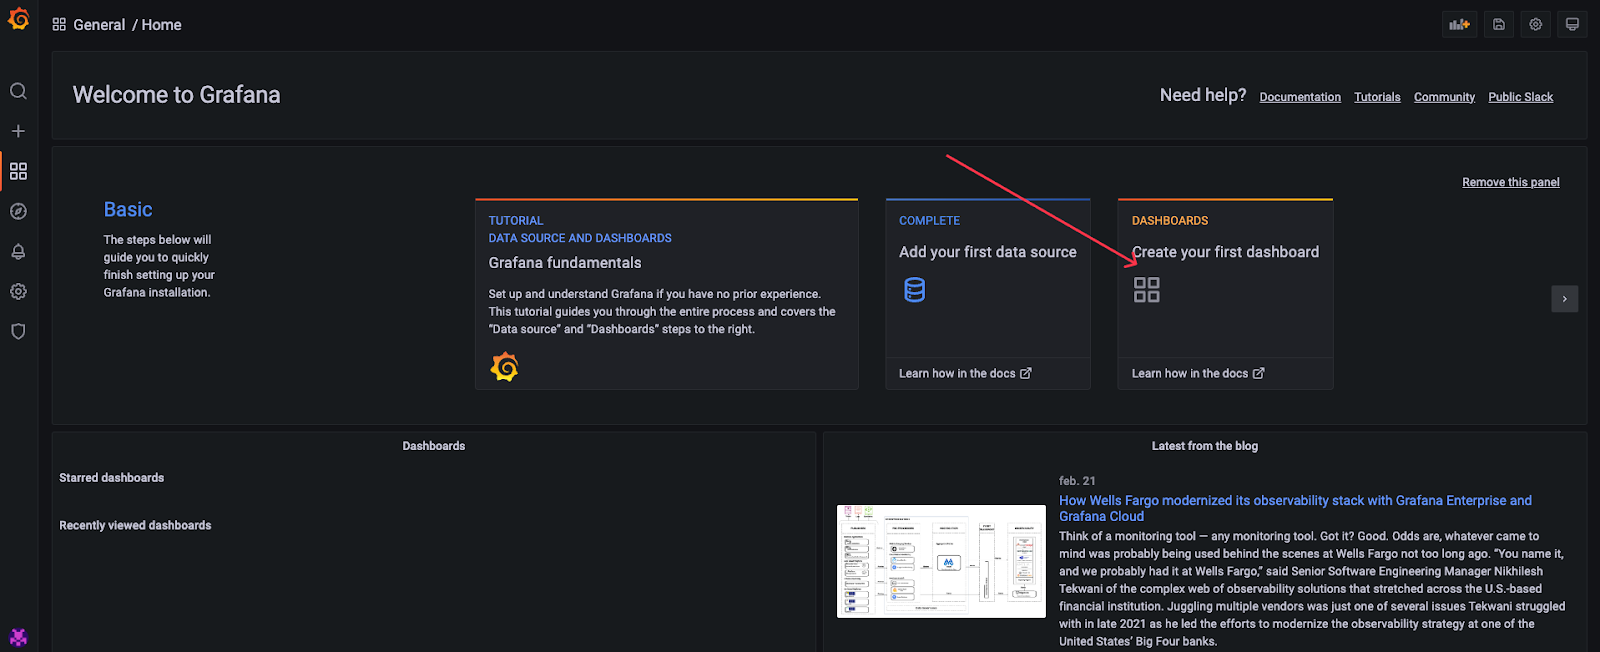
- Login in Grafana and click the “Create your first dashboard” card
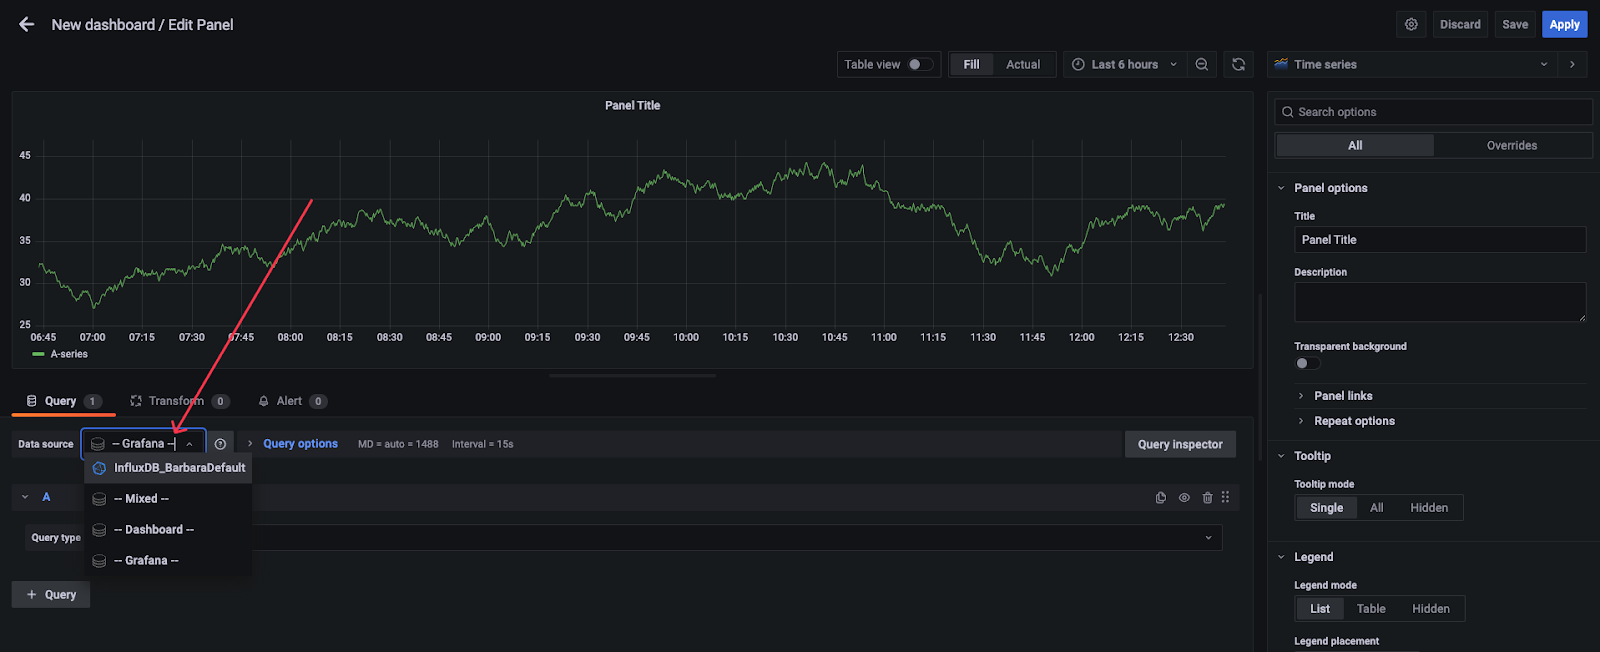
- Select “Add a new panel”
- In the “Data Source” field select “InfluxDB_BarbaraDefault”
- In the space for queries type the following text

from(bucket: "barbara")
  |> range(start: v.timeRangeStart, stop: v.timeRangeStop)
  |> filter(fn: (r) => r["_measurement"] == "testDevice" or r["_measurement"] == "testDevice2")
  |> filter(fn: (r) => r["_field"] == "testVariable" or r["_field"] == "testVariable2" or r["_field"] == "testVariable4" or r["_field"] == "testVariable5")
  |> aggregateWindow(every: v.windowPeriod, fn: mean, createEmpty: false)
  |> yield(name: "mean")

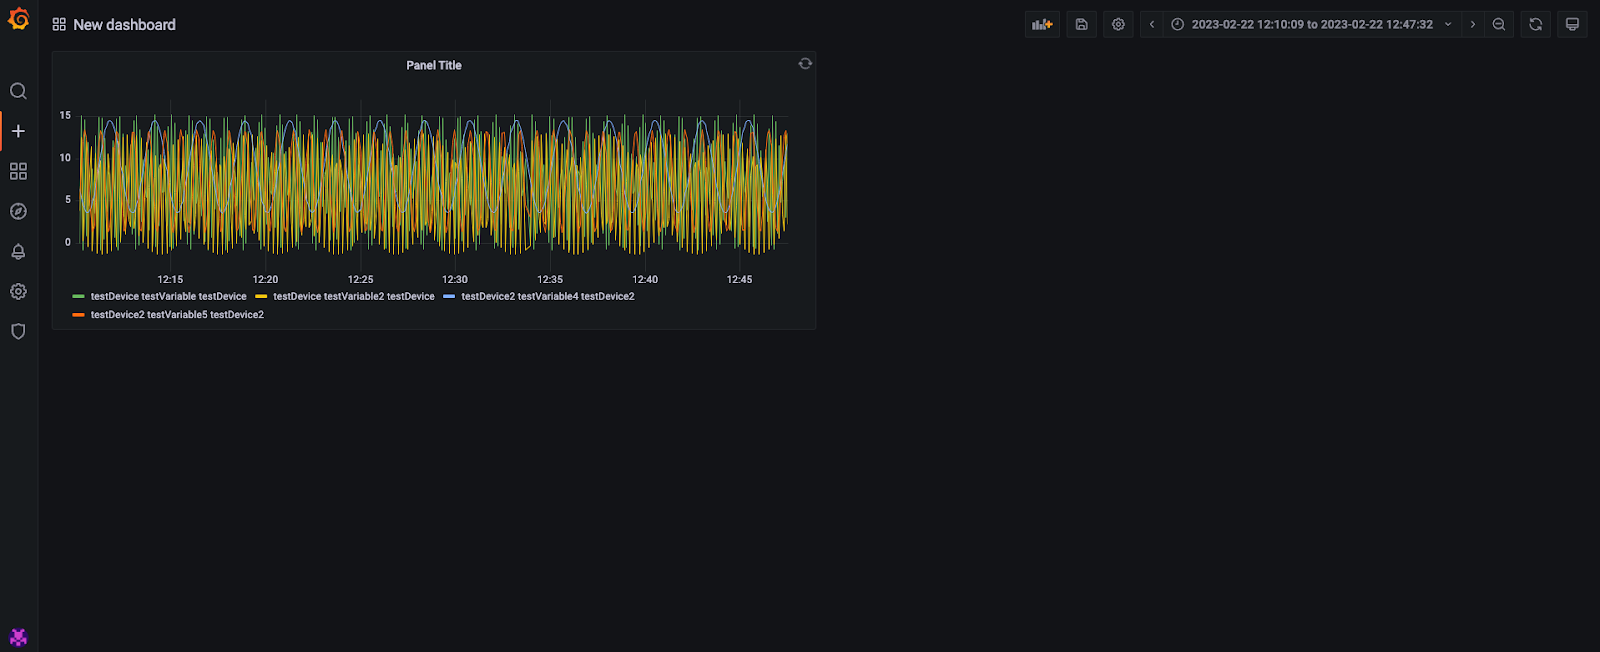
- Click in the Apply button and you will now see a new panel in your dashboard