
The new version v2.3.0 of the Barbara platform focuses on making it easier to manage your edge applications, giving you a new view centered on them, and making general information monitoring of your nodes more user-friendly.
Focus on your deployed applications with the new SPACES view
The new SPACES view shifts the focus from Edge Nodes to Applications, allowing you to view all deployed applications across all nodes on a single screen. This perspective centers on the application rather than individual nodes.
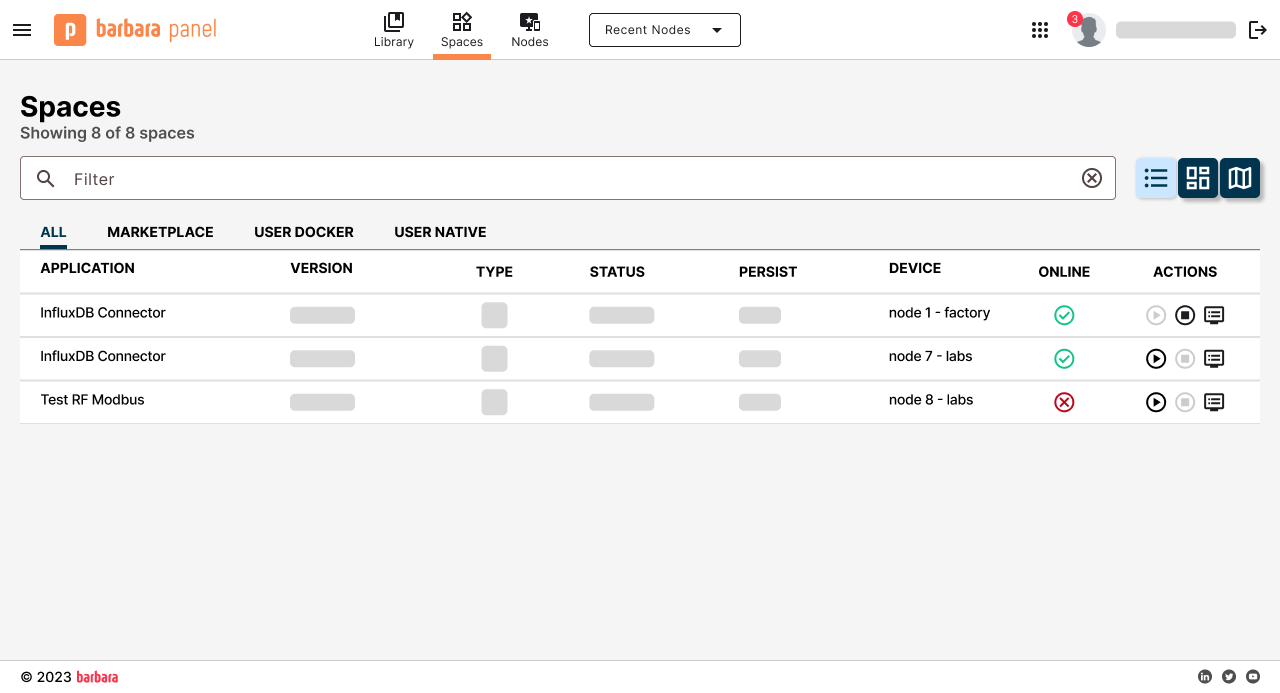
With this view, you can perform management operations such as starting and stopping applications and viewing their logs in a separate window.
Access node information more easily and conveniently
Previously, the “GENERAL INFO” card contained all the relevant information about the device’s status, including general data like connection and location, telemetry that measured node usage based on various parameters such as RAM and CPU, and network status that provided information about the networks the node was connected to.
However, this card contained so much information that it could be difficult to use at times. To address this, we’ve divided this information into three separate cards that you can show or hide as needed.
The GENERAL INFO card
Now, this card gathers all the information about the Edge Node, such as its ID, hardware model, or location, among other details.
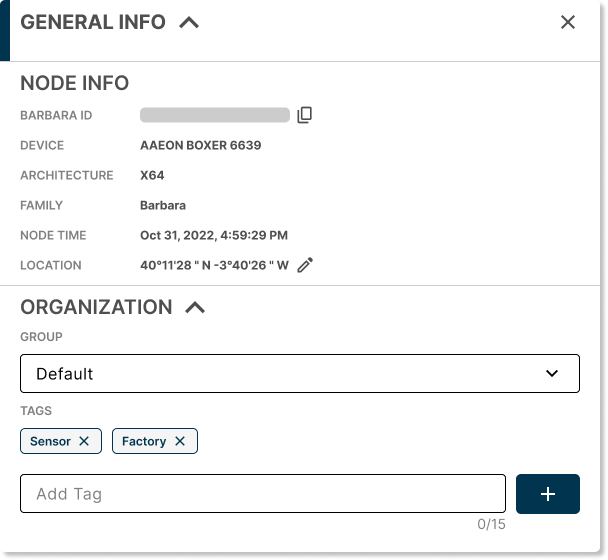
Moreover, you can easily reassign the node to a different group or modify its tags directly from this card.
The TELEMETRY card
Get node health information at your fingertips with the new card. This card displays essential node health parameters, such as CPU temperature or system load, as frequently as you want.
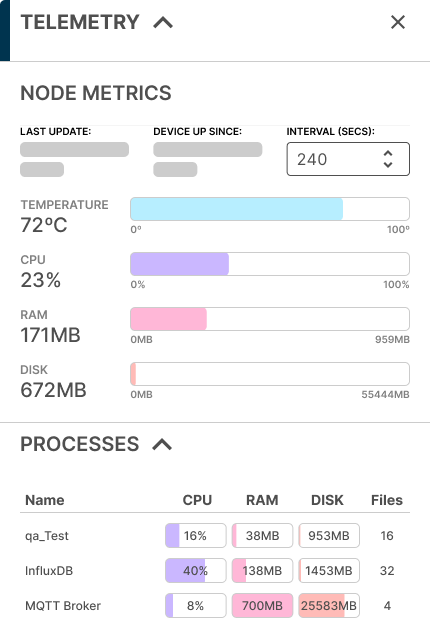
Additionally, you can quickly check the consumption level of each process running on your node.
We’ve made changes to the display, too. We no longer show the trend over time of these parameters, but that’s because we’ve created a more powerful ANALYTICS card that allows you to review the history of several node parameters, including the four parameters we display in TELEMETRY.
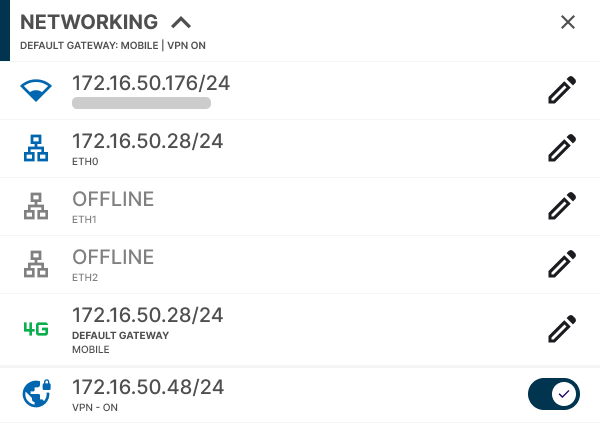
The NETWORKING card
This card contains all the information related to the network interfaces of the node. You can see which interface is active and modify the connection details of each one of them.
Other changes
In line with the new way of displaying information, we have also simplified the information displayed in the top menu to focus on what’s important and relegating the rest of the information to the GENERAL INFO card.
Likewise, we have simplified the central operation icons of the top menu by removing the button that allowed us to edit device information. Now you can edit the device name directly by clicking on it, and the rest of the information can be edited from the GENERAL INFO card.
Check the historical health data of your nodes: The new ANALYTICS card
We’ve created a new card called “ANALYTICS” so you can easily check the historical data related to your edge nodes’ health parameters over time. This new card allows you to choose the parameter to analyze, the time frame to analyze (relative to the present time or absolute, indicating a specific time range), and even filter the measure for certain processes.
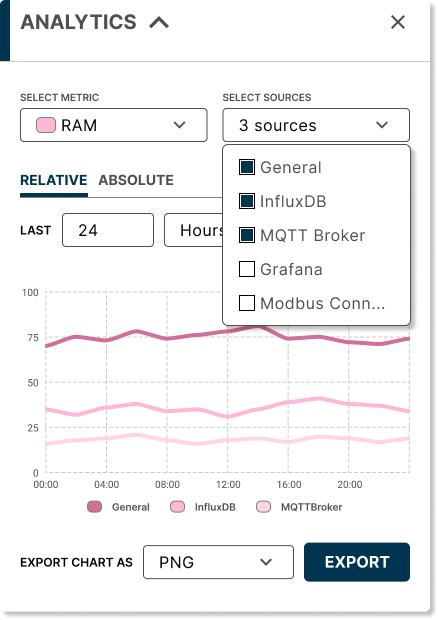
In this first version of the ANALYTICS card, you can review the following parameters:
- Temperature: the CPU temperature of your node reported in degrees Celsius
- RAM: the degree of RAM memory consumption of your node
- DISK: the degree of storage memory occupation of your node
- System Load: the percentage level of general workload of your node’s system
- CPU: the percentage level of workload of your node’s system for each active process
- Files: the number of files each process has open
Work more comfortably with SECRETS and CREDENTIALS
If you’re not familiar with them, SECRETS and CREDENTIALS are user-password pairs that can be preloaded on your nodes and then used by them.
- SECRETS are global variables that you define on your node and can be referenced from different applications installed on your device. If you set a secret, you can refer to it in your application code using the name of the secret as the variable name.
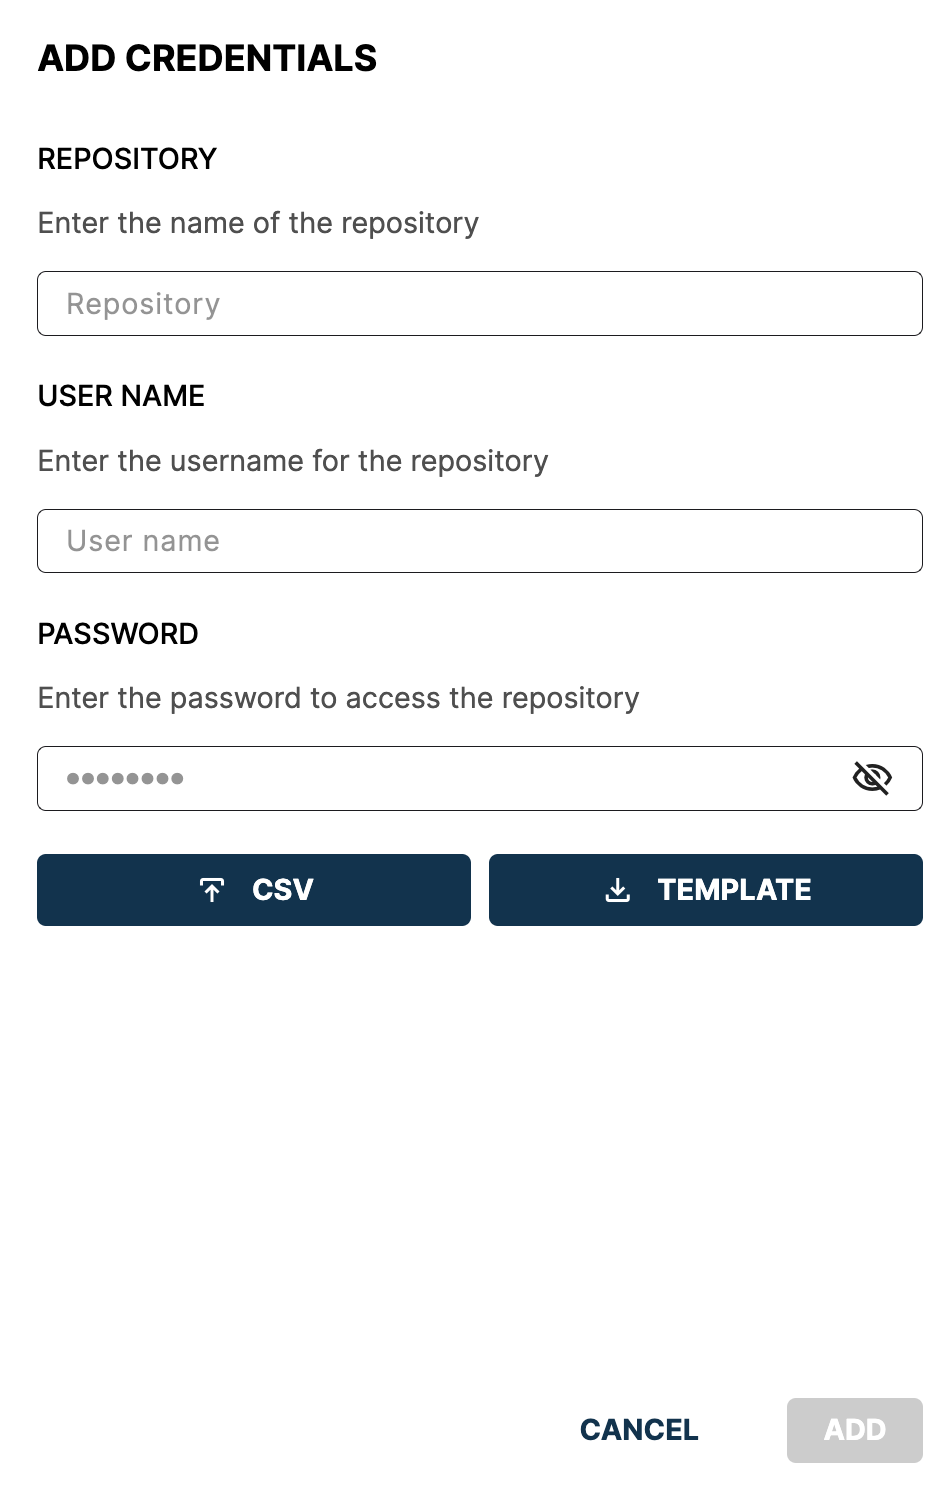
- CREDENTIALS are used to log in to private Docker repositories so that you can download images from them.
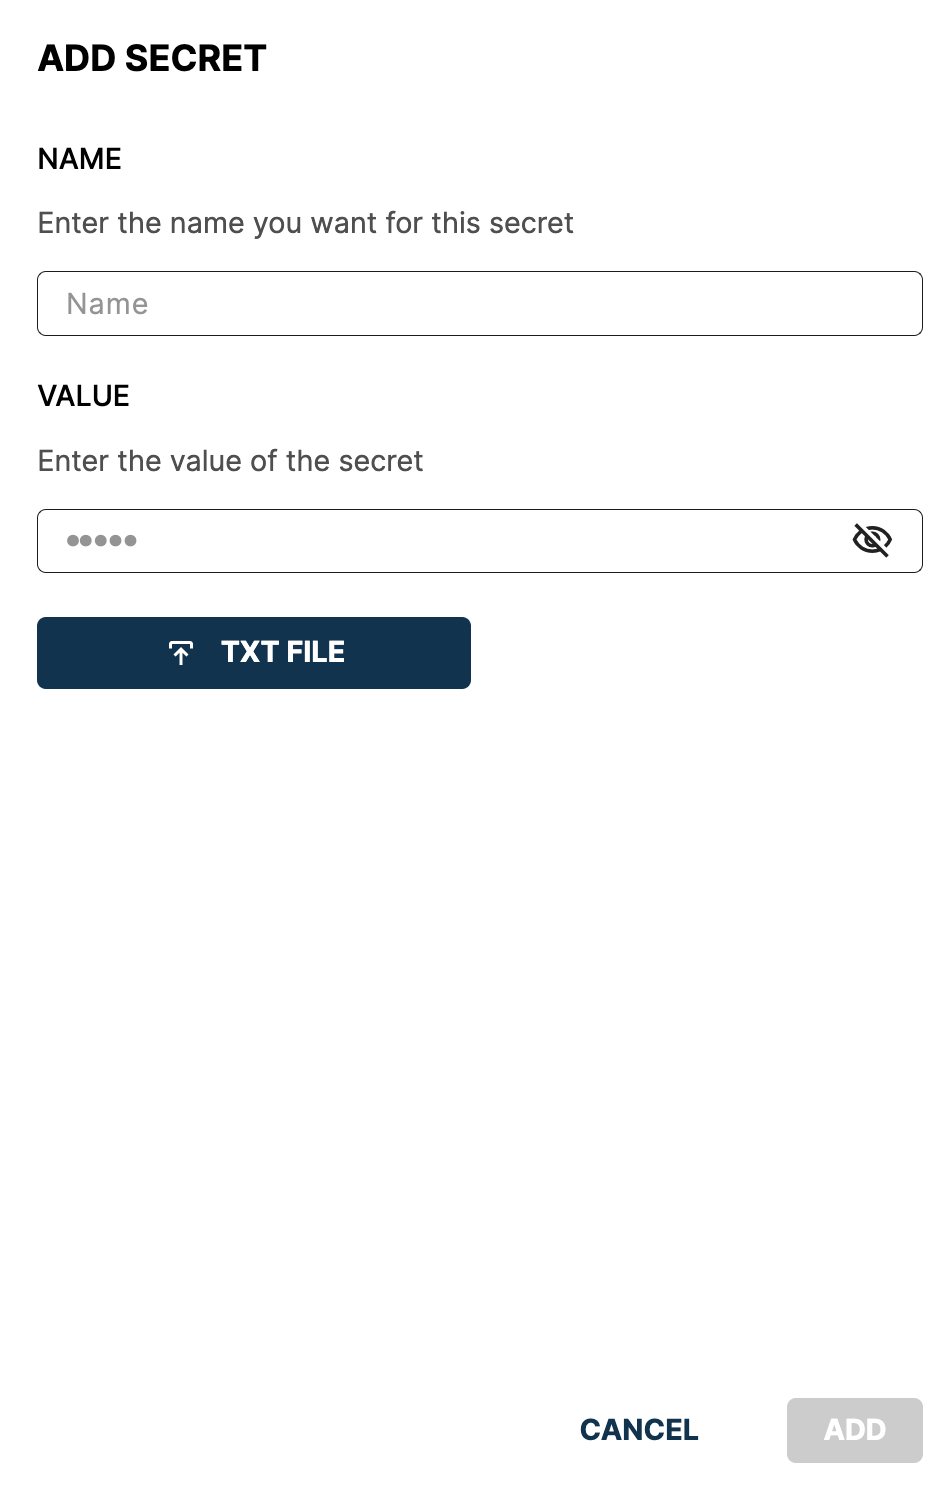
Until now, in the Barbara Panel, both secrets and credentials had to be added one by one. However, in version 2.3.0, we have added a button to directly import a file from your computer that contains all the secrets and credentials you want to add in a single operation.
- The format of the file to import the credentials is a .CSV. You will see that you can download a template.
- If you want to import secrets, you can simply upload a .TXT file in which each row contains the Name and Value of each secret separated by a blank space.
Bonus: small interface improvements
At Barbara, we always focus on designing the most complete but also the most comfortable tool for teams responsible for deploying applications on the Edge. That’s why we don’t want to forget to mention some small details and changes we’ve implemented in the new version 2.3.0.
- In this new version, we’ve included a usability improvement that will allow you to know if your nodes have the latest version of our software or need to be updated. In the details view of each node, in the main menu section, you will see that the update buttons for the Operating System and the Node Manager will display an orange notification bubble whenever a new version is available for them.
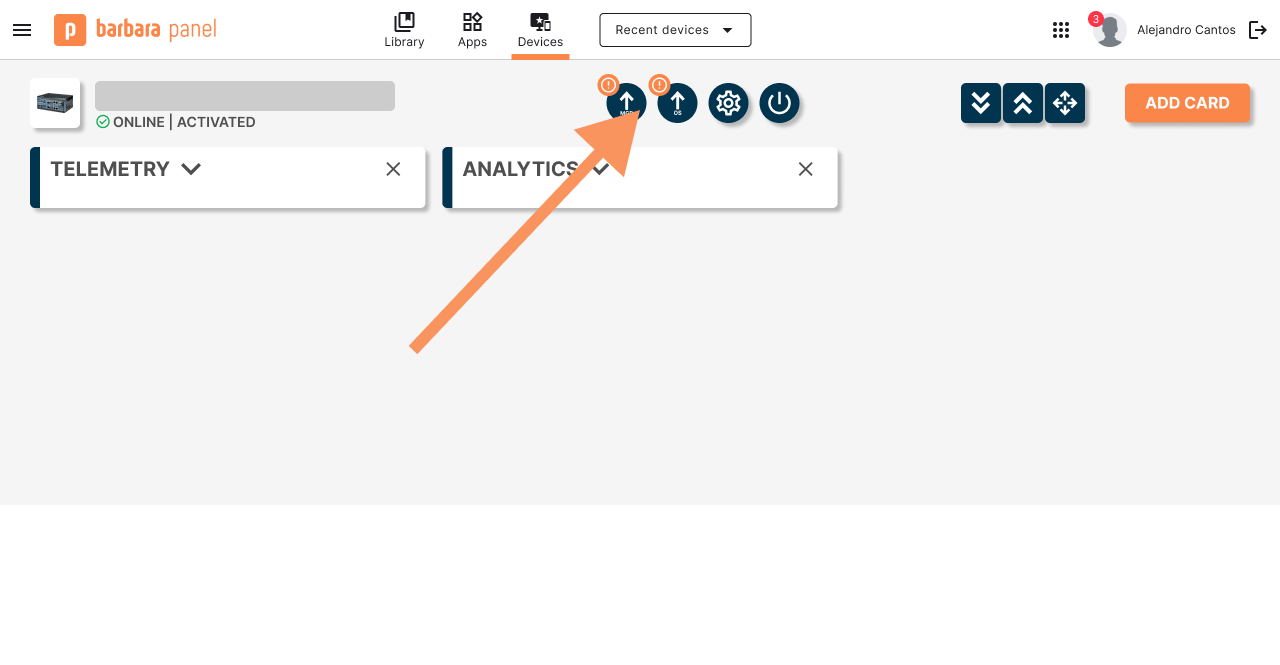
This way, it will be easier for you to know which devices you need to update and schedule their updates according to your needs.
- We’ve introduced a new color scheme to distinguish between various application card types, such as Marketplace Apps (which are purchased through the Marketplace), User Docker Apps (docker apps uploaded by you or your colleagues), and User Native Apps (native apps uploaded by you or your colleagues).

- We’ve enabled application logs by default to avoid unwanted data loss due to not activating them on time.

- We’ve also made some small aesthetic changes to improve the visualization of the cards